Videopokerisimulaattori
(c) Jussi Palomäki, 2023
Videopokerisimulaattorin tarkoitus on havainnollistaa tyypillisen videopokeripelin voittojen ja häviöiden jakautumista useiden eri pelaajien välillä. Simulaattori on viestinnällinen työkalu. Se on tarkoitettu erityisesti pelaajille, jotka eivät ole perehtyneet rahapelien logiikkaan ja joilla on tavanomaista korkeampi r * Käsien voittosumma euroissa korkean / keskitason / matalan volatiliteetin pelissä (sulkeissa todennäköisyys optimistrategialla) + Kuningasvärisuora: 2000e / 500e / 100e (0.002%) + Värisuora: 50e / 55e / 50e (0.011%) + Neljä samaa: 33e / 45e / 30e (0.236%) + Täyskäsi: 14e / 13e / 15e (1.151%) + Väri: 7e / 7e / 8e (1.101%) + Suora: 5e / 6e / 7e (1.123%) + Kolme samaa: 3e / 3e / 3e (7.445%) + Kaksi paria: 2e / 2e / 2e (12.928%) * Palautusprosentit optimistrategialla: 89.955% (korkea volaahapeliongelman riski. Videopokerisimulaation taustaoletukset:
- Jokaisessa panostuskierroksessa on 1 euron panos
- Pelataan 5 panostuskierrosta minuutissatiliteetti) ja 89.934% (matala volatiliteetti)
- Simulaatioissa oletetaan, että pelaajat pelaavat peliä optimistrategiaa hyödyntäen
- Kuvissa havainnollistetaan “onnekkain” ja “epäonnekkain” pelaaja, eli parhaiten ja heikoiten simulaation lopussa menestynyt pelaaja
- Simulaatiot eivät todennäköisesti vastaa yksityiskohdiltaan esimerkiksi Veikkauksen tarjoamia videopokeripelejä (Veikkauksen yksityiskohtaiset pelitiedot eivät ole saatavilla)
TL;DR: Alla esitetään videopokerisimulaatioita tyypillisestä videopokeripelistä. Mitä enemmän peliä pelaa, sitä enemmän rahaa häviää. Jotkut harvat ja onnekkaat saattavat jäädä pelistä lyhyellä aikavälillä voitolle, erityisesti jos pelissä on korkea volatiliteetti. Riittävän pitkällä aikavälillä kaikki kuitenkin lopulta häviävät.
library(tidyverse)
library(gganimate)
library(transformr)
library(truncnorm)


casino_simulator <- function(rounds, players, topbottom = F, volatility = "low") {

  simulations = data.frame(nrow = 0)

  if (volatility=="low") {
    payout <- c(100, 50, 30, 15, 8, 7, 3, 2, 0) - 1
    probability <- c(0.002, 0.011, 0.236, 1.151, 1.101, 1.123, 7.445, 12.928, 76.003)/100
    ev <- sum(payout*probability) #ev = -0.10045
  }

  else if (volatility=="med") {
    payout <- c(500, 65, 45, 13, 7, 6, 3, 2, 0) - 1
    probability <- c(0.002, 0.011, 0.236, 1.151, 1.101, 1.123, 7.445, 12.928, 76.003)/100
    ev <- sum(payout*probability) #ev = -0.10066
  }

  else {
    payout <- c(2000, 50, 33, 14, 7, 5, 3, 2, 0) - 1
    probability <- c(0.002, 0.011, 0.236, 1.151, 1.101, 1.123, 7.445, 12.928, 76.003)/100
    ev <- sum(payout*probability) #ev = -0.10035
  }

  for (i in 1:players) {

    test <- sample(payout, rounds, replace=TRUE, prob=probability)
    test <- data.frame(run = test)
    names(test)[1] <- i

    simulations <- cbind(simulations, cumsum(test))
    simulations$nrow <- NULL


  }

  max_value <- which(tail(simulations, 1) == max(tail(simulations, 1))) # Among the last row, which column has the highest value
  min_value <- which(tail(simulations, 1) == min(tail(simulations, 1))) # Among the last row, which column has the lowest value

  #How many are winning at the end
  winners <- length(which(tail(simulations, 1) > 0))

  simulations$ID <- seq.int(nrow(simulations))


  simulations.long <- simulations %>%
    gather(key, value, -ID) %>%
    group_by(key) %>%
    dplyr::mutate(profit = factor(ifelse(value > 0, 1, 0)), # Is the player winning or not
                  profitriskcumsum = cumsum(as.numeric(profit)-1), # cumulative number of rounds in profit
                  randomrisk = which(sample(c(0,1), n(), prob=c(.9999603, 1-.9999603), replace=T) == 1)[1], #among n(), produce a moment when problem gambling starts. Probability: 84 (one full week) hours of playing one has 50% chance of becoming "problem gambler" (or "high risk gambler"). 84 * 60 minutes * 5 rounds = 25200 (1- 1/25200 =  .9999603)
                  randomrisk = ifelse(is.na(randomrisk), n(), randomrisk), #if prob gambling doesn't start, replace NA with total length of sample
                  randomrisk = c(rep(0, randomrisk[1]), rep(1, n() - randomrisk[1])), #vector with 0s until problem gambling starts (1s); have to index at 1 since rep-counts argument is a vector of identical values
                  problem = factor(case_when(profitriskcumsum > 900 | randomrisk == 1 ~ sample(c("Not at risk", "At risk"), 1, prob=c(.5, .5)), # when winning too much, 50% chance of becoming probl. gambl. OR random risk of becoming problem gambler
                                             TRUE ~ "Not at risk"))) %>%
    ungroup()

  #profitrisk = ifelse(profitriskcumsum > 900, sample(c(0, 1), 1, prob = c(.9, .1)), 0),
  #TODO (24.2.: randomly have some players become problem gamblers should they play long enough!!!)
  # which(sample(c(0,1), n(), prob=c(.999, .001), replace=T) == 1)[1] <-- kuinka monennes yksilö oli eka "1"
  # rep(0, which(sample(c(0,1), 3000, prob=c(.999, .001), replace=T) == 1)[1]) #toista "0" niin monta kertaa kuin tuli eka 1
  # rep(1, 3000 - which(sample(c(0,1), 3000, prob=c(.999, .001), replace=T) == 1)[1]) #toista "1" loput kerrat 3000sta
  # yhdistä:
  # sample <- which(sample(c(0,1), 3000, prob=c(.999, .001), replace=T) == 1)[1]
  # c(rep(0, sample), rep(1, 3000 - sample))

  # Plot all players (EDIT 24.2., plot based on problem gambling [ALPHA VERSION])

  plot <- simulations.long %>%
    dplyr::mutate(problem = fct_relevel(problem, "Not at risk")) %>% #force factor level order (simulations mess this up every now and then...)
    ggplot(aes(ID, value, group=key)) + # group=key here required for complex animation
    geom_line(aes(colour = problem, size = problem)) +
    geom_abline(intercept = 0, slope = ev, linetype="dashed", size=0.5, color="red", alpha=.5) +
    geom_hline(yintercept = 0, size=0.5, alpha=.5) +
    xlab("Pelatut tunnit") + ylab("Raha (euroja)") +
    theme_minimal(base_size=14) +
    scale_x_continuous(breaks = seq(0, rounds, by = 600), #by = 600 on by 2 hours (i.e. 600 rounds / 5 / 60)
                       labels=function(x)round(x/5/60, 1)) +
    theme(legend.title = element_blank(),
          legend.position = "top") +
    scale_color_manual(values=c("lightblue", "red")) +
    scale_size_manual(values = c(.3, 1))
    # guides(color="none")

  # Plot only the top and bottom "players"
  plot2 <- simulations.long %>%
    dplyr::filter(key == max_value | key == min_value) %>%
    dplyr::mutate(key = factor(key, levels = c(max_value, min_value),
                               labels = c("Onnekkain\npelaaja", "Epäonnekkain\npelaaja"))) %>%
    ggplot(aes(ID, value, group=key)) +
    geom_line(aes(colour = key)) +
    geom_abline(intercept = 0, slope = ev, linetype="dashed", size=0.5, color="red", alpha=.5) +
    geom_hline(yintercept = 0, size=0.5, alpha=.5) +
    xlab("Pelatut tunnit") + ylab("Raha (euroja)") +
    theme_minimal(base_size=14) +
    scale_x_continuous(breaks = seq(0, rounds, by = 600), # Jos visualisoidaan alle tunti, x-akseli ei näy oikein!
                       labels=function(x)round(x/5/60, 1)) +
    guides(color="none")

  # Combined plot
  # (code may fail if there are 3 or more identical values (shared bottom or top))
  plot3 <- simulations.long %>%
    dplyr::mutate(maxmin = case_when(key == max_value ~ "Onnekkain\npelaaja",
                                     key == min_value ~ "Epäonnekkain\npelaaja",
                                     TRUE ~ "Muut"),
                  maxmin = factor(maxmin, levels = c("Onnekkain\npelaaja", "Epäonnekkain\npelaaja", "Muut"))) %>%
    ggplot(aes(ID, value, group=key)) +
    geom_line(aes(colour = maxmin, alpha = maxmin, size = maxmin)) +
    geom_abline(intercept = 0, slope = ev, linetype="dashed", size=0.5, color="red", alpha=.5) +
    geom_hline(yintercept = 0, size=0.5, alpha=.5) +
    xlab("Pelatut tunnit") + ylab("Raha (euroja)") +
    scale_color_manual(values=c("blue", "red", "grey")) +
    theme_minimal(base_size=14) +
    theme(legend.title = element_blank(),
          legend.position = "top") +
    scale_x_continuous(breaks = seq(0, rounds, by = 600),
                       labels=function(x)round(x/5/60, 1)) +
    scale_alpha_manual(values = c(1, 1, .3)) +
    scale_size_manual(values = c(1, 1, .5))


  if (topbottom == F) {
    return(plot3)
    }
  else {
    return(plot2) #plot for problem plot, plot2 for top and bottom, winners for number of winners at end. Visualizations work with "plot2"
    }
}
Matala volatiliteetti
Animaatio
Jos sinä ja 99 kaveriasi pelaatte kaikki 10 tuntia matalan volatiliteetin videopokeria, teistä lopulta onnekkain ja epäonnekkain pelaaja menestyy näin:
set.seed(1)
animation <- casino_simulator(3000, 100, T, "low") +
  geom_segment(aes(xend = 3000, yend = value), linetype = 2, colour = 'grey') +
  geom_point(size=2) +
  geom_text(aes(x = 3000, label = key, color=profit), hjust = 0) +
  geom_text(aes(x = ID, label = round(value, -1), color = profit), vjust=2) +
  scale_color_manual(values=c("red", "darkgreen", "salmon", "lightblue")) +
  transition_reveal(ID) +
  coord_cartesian(clip = 'off') +
  theme(plot.margin = margin(5.5, 50, 5.5, 5.5))

animate(animation, duration = 15, fps = 10)
Kaikki havainnot
set.seed(1)
casino_simulator(3000, 100, F, "low")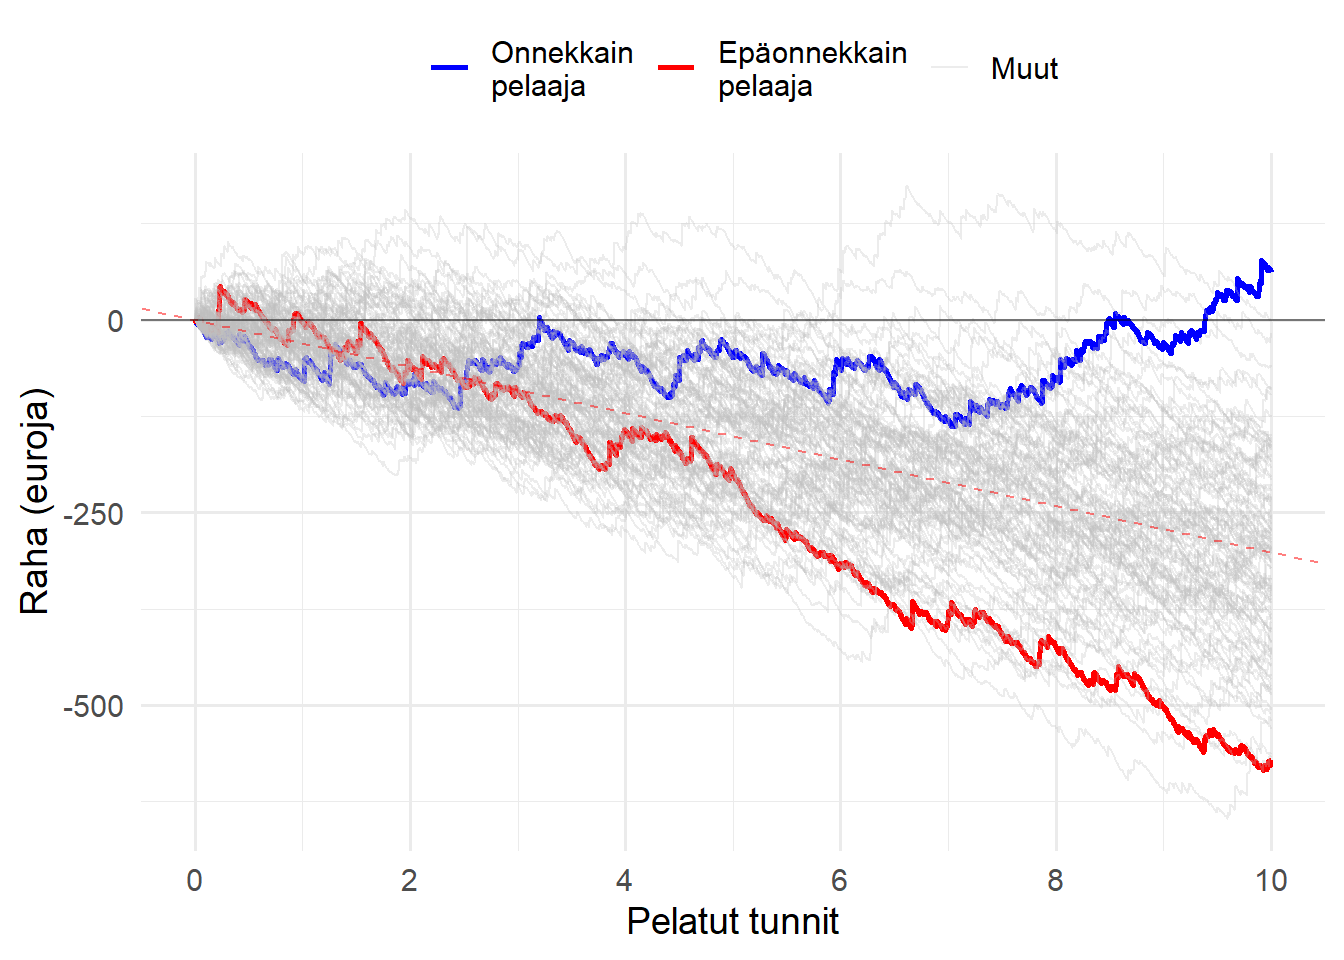
Korkea volatiliteetti
Animaatio
Jos sinä ja 99 kaveriasi pelaatte kaikki 10 tuntia korkean volatiliteetin videopokeria, teistä lopulta onnekkain ja epäonnekkain pelaaja menestyy näin:
set.seed(1)
animation <- casino_simulator(3000, 100, T, "med") +
  geom_segment(aes(xend = 3000, yend = value), linetype = 2, colour = 'grey') +
  geom_point(size=2) +
  geom_text(aes(x = 3000, label = key, color=profit), hjust = 0) +
  geom_text(aes(x = ID, label = round(value, -1), color = profit), vjust=2) +
  scale_color_manual(values=c("red", "darkgreen", "salmon", "lightblue")) +
  transition_reveal(ID) +
  coord_cartesian(clip = 'off') +
  theme(plot.margin = margin(5.5, 50, 5.5, 5.5))

animate(animation, duration = 15, fps = 10)
Kaikki havainnot
set.seed(1)
casino_simulator(3000, 100, F, "med")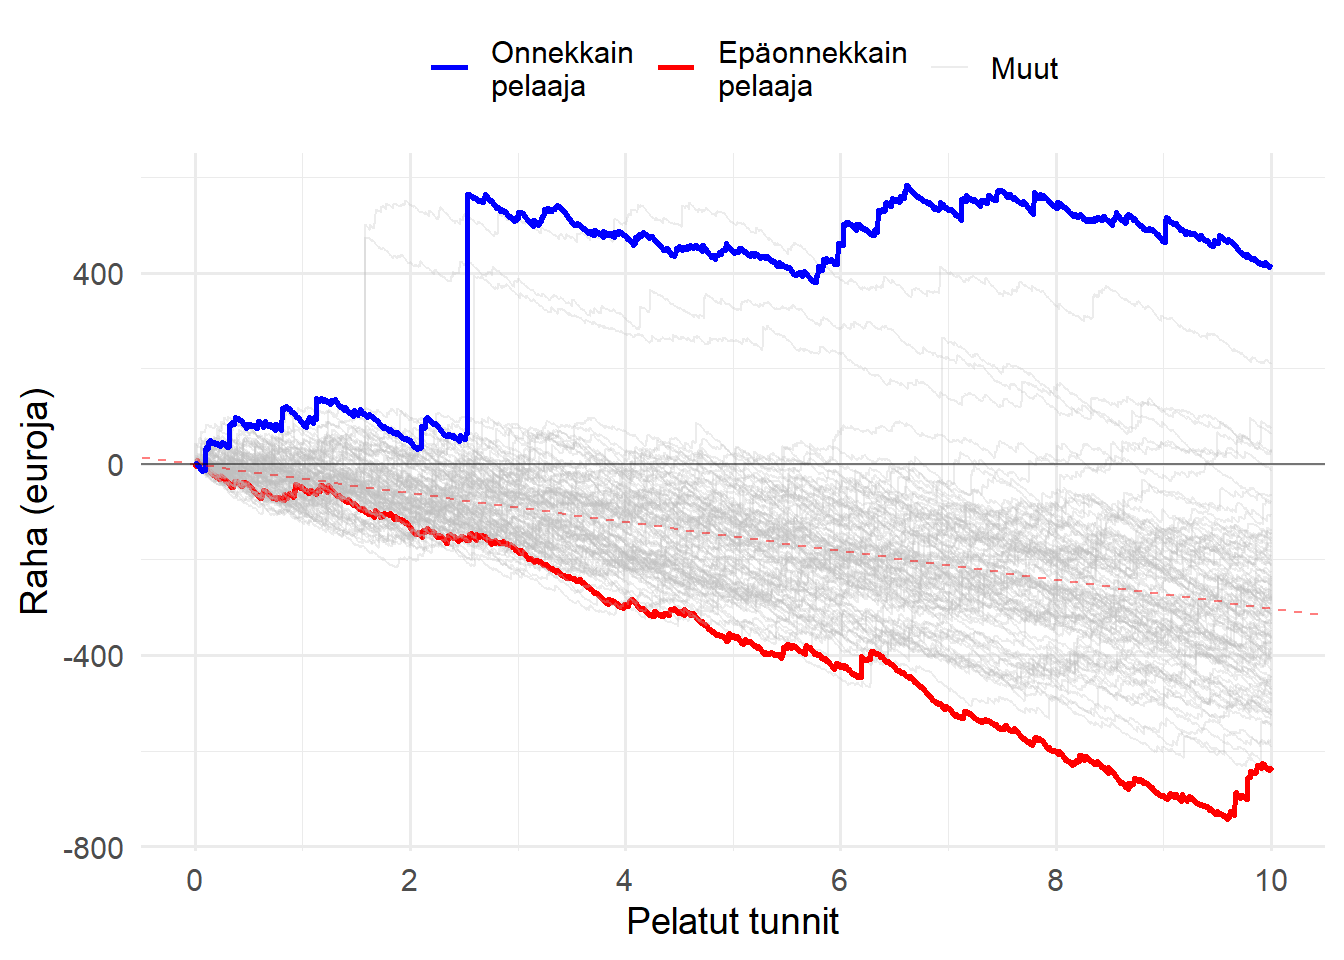
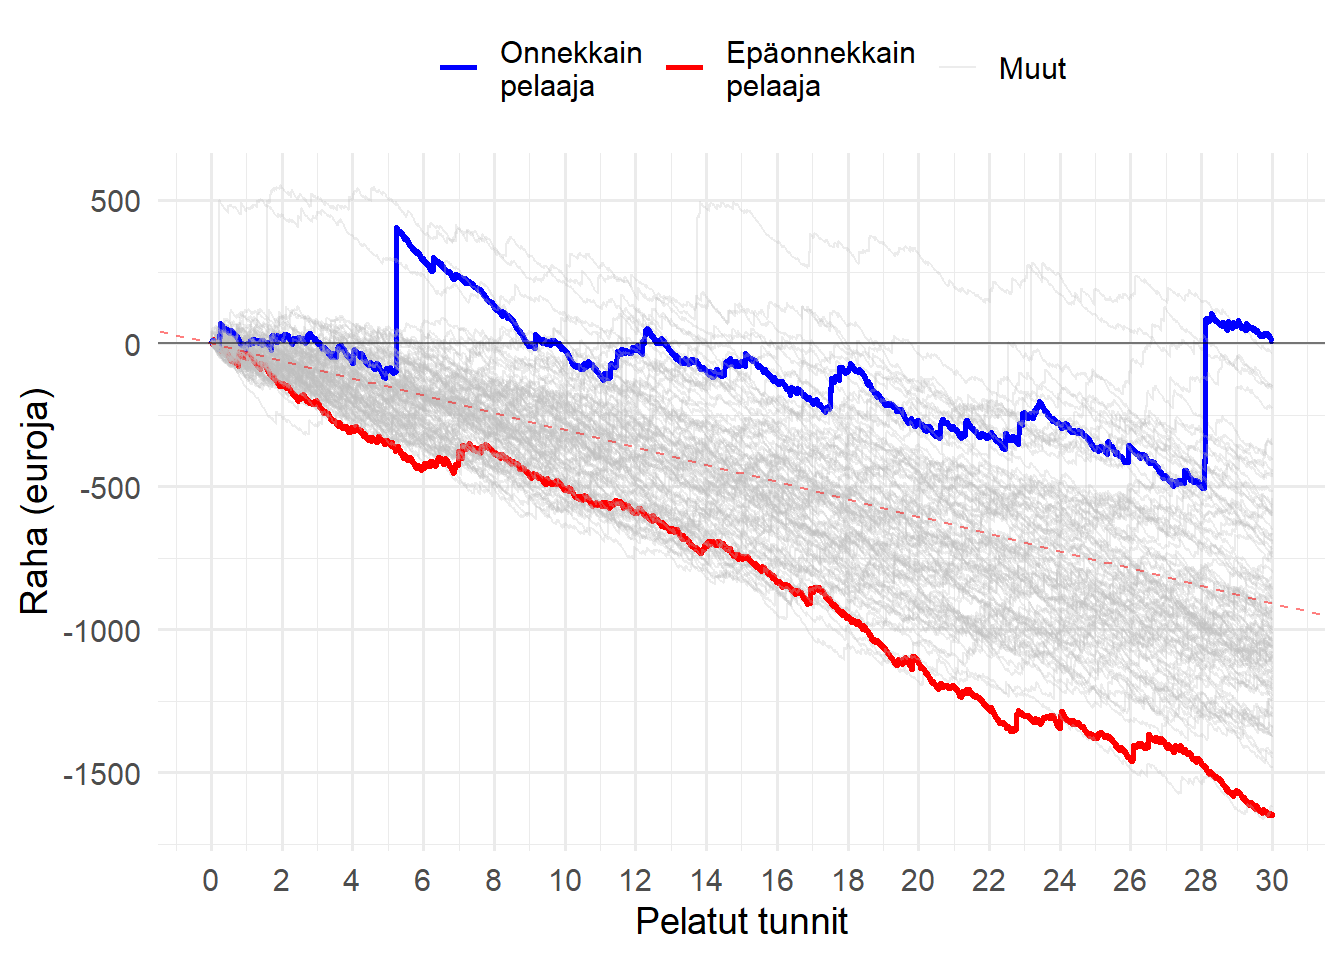
Korkea volatiliteetti (pidempi ajanjakso)
Animaatio
Jos sinä ja 99 kaveriasi pelaatte kaikki 30 tuntia korkean volatiliteetin videopokeria, teistä lopulta onnekkain ja epäonnekkain pelaaja menestyy näin:
set.seed(1)
animation <- casino_simulator(9000, 100, T, "med") +
  geom_segment(aes(xend = 9000, yend = value), linetype = 2, colour = 'grey') +
  geom_point(size=2) +
  geom_text(aes(x = 9000, label = key, color=profit), hjust = 0) +
  geom_text(aes(x = ID, label = round(value, -1), color = profit), vjust=2) +
  scale_color_manual(values=c("red", "darkgreen", "salmon", "lightblue")) +
  transition_reveal(ID) +
  coord_cartesian(clip = 'off') +
  theme(plot.margin = margin(5.5, 50, 5.5, 5.5))

animate(animation, duration = 25, fps = 10)
Kaikki havainnot
set.seed(1)
casino_simulator(9000, 100, F, "med")